 NWA June 2019 Newsletter
Issue 19 - 6
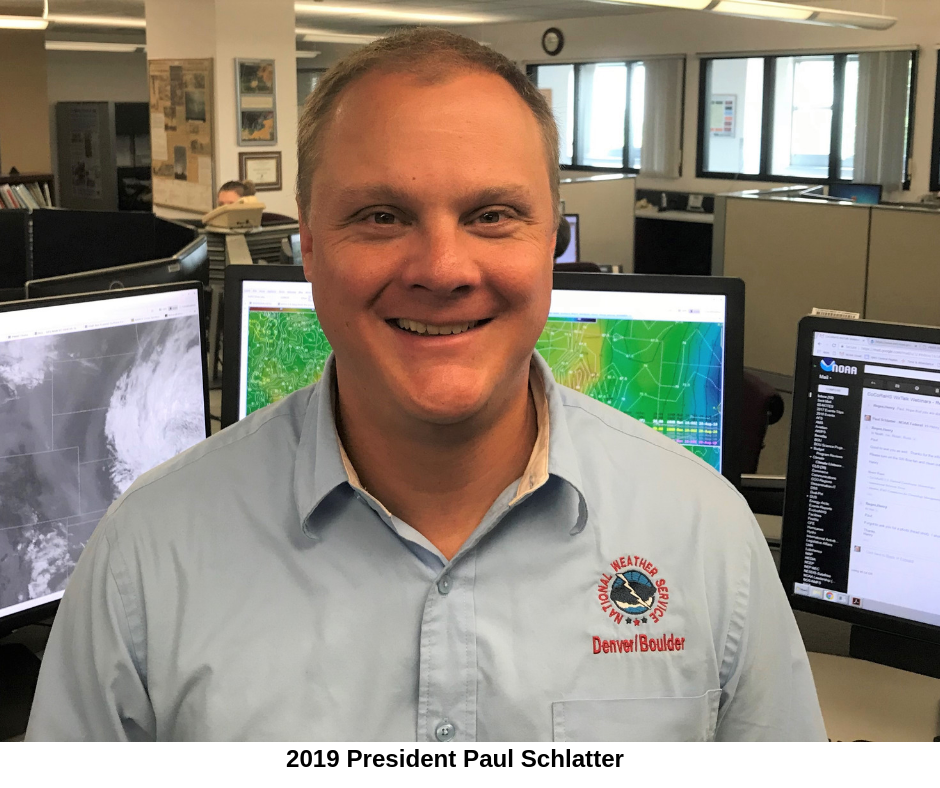
NWA President Paul Schlatter
Welcome to summer! With the arrival of summer comes an increase in thunderstorm activity, as well as an increase in people participating in outdoor activities. My neighborhood pool in Arvada, Colorado, opened May 25 after 5 inches of snow fell four days prior, and between then and Labor Day there will be many lightning delays or closures (which is great in the name of safety). It is thus not a surprise that we focus on lightning safety efforts during National Lightning Safety Awareness Week, June 23–29. This June edition of the NWA newsletter focuses on lightning and lightning safety. As most of you are aware, lightning is a sudden and violent electrostatic discharge--a spark--with enough power (~30,000 amps) and heat (~30,000 degrees Celsius) to start fires, fry electronics, and kill people. In Colorado where I live, lightning has been the number one weather related killer over the past 15 years with an average of 1.7 deaths per year. I have had several close calls with lightning strikes over my 42 years of existence, and I’d like to share two of them. My first close call occurred eight years ago in June 2011. I moved my family to the Washington, D.C., area two months prior near the well-known Rock Creek Trail bike path. It was a nice June afternoon at the end of National Lightning Safety Awareness Week, and I wanted to take my family out for a bike ride on the trail. My kids were very young in 2011 (3 and 5 years old), so they rode on attachment bikes while my wife and I pulled them along. Thunderstorms were in the forecast for that afternoon, but local radar didn’t show anything nearby. When I checked for towering cumulus on the horizon as we departed, I didn’t see anything but very hazy, clear skies. After growing up in Colorado and then living in Oklahoma for 12 years, my conceptual model for observing the atmosphere included being able to see features roughly 20–40 miles away most of the year. The air in Oklahoma and Colorado is typically not as hazy as in the D.C. area, and dense tree canopies were never an issue in either place. This was my first mistake, because had I been able to see more than 5 miles away, I would have seen the towing cumulus going up to our northwest. After going about 5 miles down the path, we reached a playground where the kids could stretch their legs and have fun. As they started playing, I heard the first rumble of thunder. It was a ways off and I never saw the flash, but unbeknownst to me in Maryland that is normal because of the restricted visibility. Before the ride, I foolishly assumed that the playgrounds and parks along the bike path would have adequate shelter in case thunderstorms developed. As I scanned the playground, all I found was a shingled wooden canopy with wide open walls held up by four metal poles. Fantastic. We’d be dry but still an easy target for lightning. Nothing was safe at that playground so I made the decision to get back on the bikes and head back north to our apartment as quickly as we could, hopefully finding a suitable shelter on the way. What didn’t occur to me is that the very reason everyone loves the Rock Creek Trail is the same reason it is terrible for shelter from lightning—the trail is not near any building or structure, and we needed to traverse a big hill before getting off the trail. By the time we started down the big hill there were cloud-to-ground strikes all around us. At one point I saw lightning hit a clearing in the trees 200 feet away. The crack and flash were instantaneous. We were far from a shelter of any kind, and up ahead was a long metal bridge probably 25 feet above the roadway it crossed. On the other end of the bridge was a school we could have taken shelter in, but that was another 6 to7 minutes away from where we were. We decided to ride out the storm in the middle of the forest next to a grove of tall bushes that were under the much taller tree canopy (the trees are 60–80 feet tall). We made ourselves as small as possible, and as the rain and wind pounded us, there was at least one other extremely close cloud-to-ground strike and many others that were only a quarter to a half mile away. While the kids were afraid and cold, they thankfully suffered no psychological effects after being in the middle of a strong thunderstorm with nowhere to shelter. As the storm subsided, I kept my sense of humor by remarking to my wife that the next Washington Post headline could have said: “Local meteorologist gets struck by lightning during National Lightning Safety Awareness Week”. My wife did not find it funny, and I am pretty sure I haven’t been forgiven for getting us in that much trouble... rightfully so!
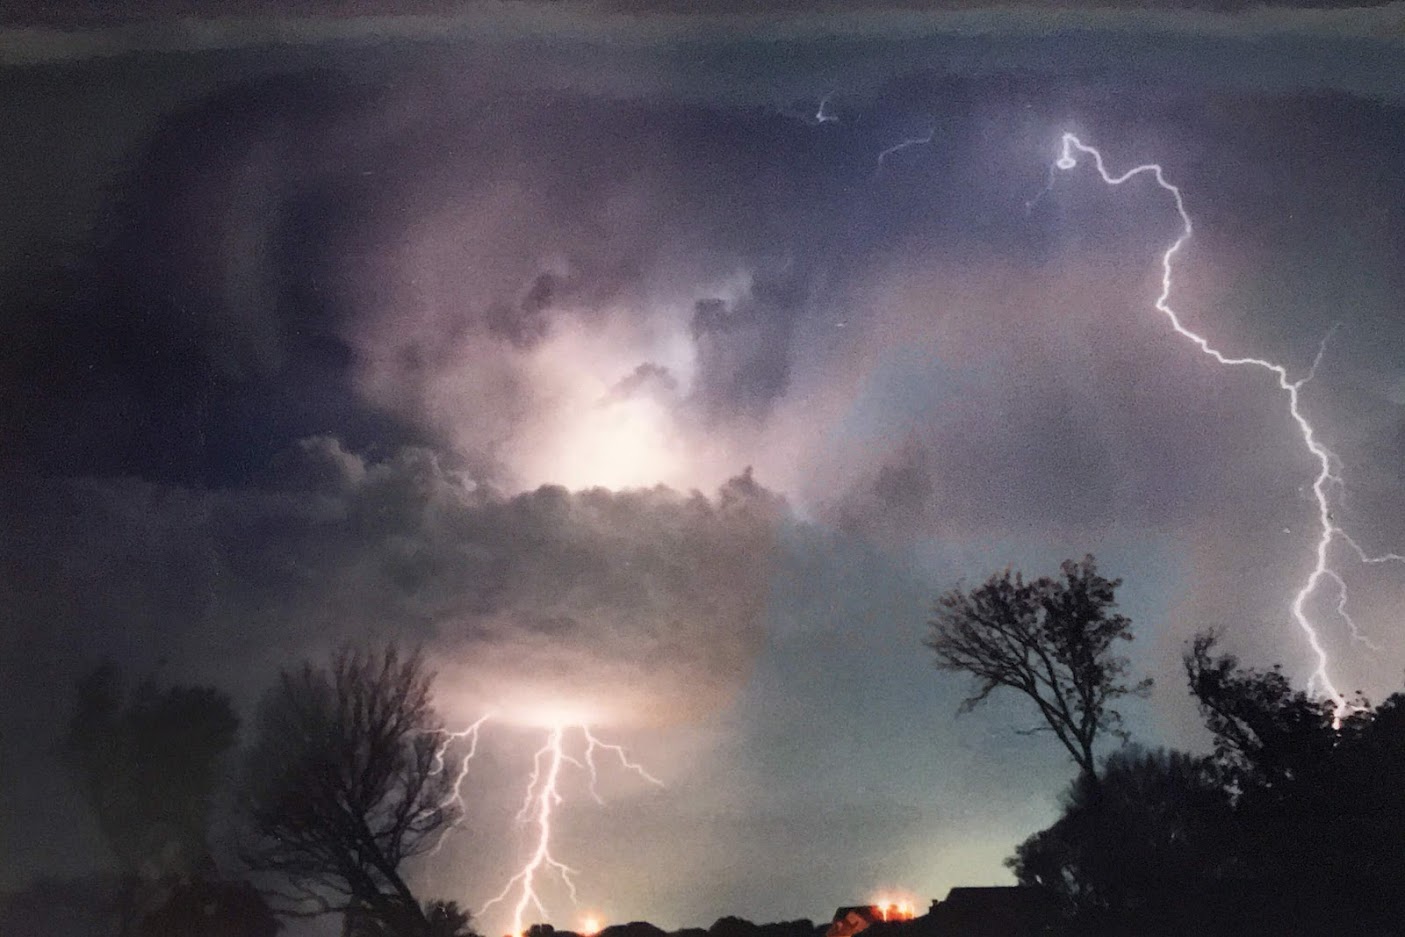
I took this photo on October 9, 2001, outside my house in Norman, Oklahoma. It’s my best lightning shot. My other close call with lightning occurred when I was a teenager hiking with my Dad in central Colorado. We had just ascended La Plata Peak, a 14,360-foot summit and the fifth highest in Colorado. As I have mentioned in previous articles, my dad is a meteorologist too. Back then I was already a card-carrying weather geek, and we both always paid attention to the forecast, living by the Colorado climbers’ rule: “Get off the summit before noon.” On many days in the warm season this is not early enough, so my dad usually tried to get off the summit by 10 a.m. The day we hiked La Plata Peak started as a perfect day. We reached the top a little before 10 a.m., took some photos, then noticed cumulus clouds building on nearby mountain peaks. We started heading down at a quick pace, knowing it was only a matter of time before a storm built on La Plata Peak. After about a half hour we were down to 13,000 feet when a storm overtook us and shrouded everything in thick fog. Thunder cracked and hissed all around as heavy graupel began to fall. I hope many of you have ever experienced being inside a thunderstorm above tree line, but lightning hisses and buzzes off the wet rocks and boulders. It’s a sound that is altogether awesome but frightening, and something I wish to never hear again. We then picked up the pace attempting to get down as far and as fast as possible when the hairs on my neck stood up. As soon as I said “Dad, my hair is standing-” there was a giant BOOM! There was a flash and crack instantaneously--it couldn’t have been more than a few hundred feet away. We then ran as fast as possible without injuring ourselves in the alpine terrain. A minute or so later my hair stood up again, and I only got the word “Dad” out before another tremendous CRACK then BOOM went hissing off the rocks all around us. I realize now after studying lightning that I was a point source for a stepped leader to connect to in that thunderstorm, and thus I understand how lucky I am to be alive. I think what shocked my Dad and me (pun intended) most was that even as the clouds built and graupel began in earnest, several hikers were still attempting to summit the peak. We looked at them like they were crazy as we ran past in the opposite direction. Most of them didn’t look concerned, hiking up at a comfortable pace. I will never understand that mindset. Summiting a peak is never worth your life. Probably 20 minutes after the graupel began, my dad and I made it below cloud base and eventually made it to safety. Those two stories illustrate that even when you think you know what you are doing regarding lightning safety, there will still be instances where you could find yourself in harm’s way. I give several talks a year on lightning safety and always tell these stories in the hope that people will pay attention when they are outside, and that they will make plans to find proper shelter quickly if storms threaten. I hope you all enjoy the rest of the newsletter on lightning, because I know I will. A New Perspective on Lightning Observations Lightning is a fleeting yet powerful aspect of weather. It invokes awe with its suddenness as well as fascination when a flash crosses the sky. Observations of this phenomenon offer insights ranging from storm development to the location and intensity of convective activity. The Geostationary Lightning Mapper (GLM) aboard the next generation GOES-16/-17 satellites provides a new perspective to observe lightning. The GLM is not the first space-based lightning instrument, but it is the first operational instrument of its kind in a geostationary orbit. The GLM was preceded by the Optical Transient Detector (OTD) and Tropical Rainfall Measuring Mission Lightning Imaging Sensor (LIS). Both were low-Earth orbiting sensors that provided near global observations, but only for the short period of time that the instruments were overhead. Still, both were vital in demonstrating the importance of lightning observations from space. Their observations have generated lightning climatologies and support a variety of research efforts. Unlike the OTD and LIS, the GLM’s geostationary orbit provides continuous, near hemispheric coverage. This allows for the observation of storms throughout their life cycles across GLM’s field of view. Between GOES-16/-17, the GLM covers most of North and South America as well as much of the Atlantic and Pacific Oceans. Charging for lightning is generated by an updraft in the mixed-phase region where both supercooled water droplets and ice crystals exist. Charging is greater with stronger, more voluminous updrafts in this region. Additionally, strengthening updrafts will have more chaotic electric fields that can result in smaller but more numerous flashes. As a result, the number of flashes is greatest in the updraft region. This allows for GLM observations to be used as a proxy for storm development. Increasing lightning indicates a strengthening storm while decreasing lightning indicates weakening. In certain circumstances, a very rapid increase can be considered a lightning jump, which serves as an indicator of potential severe weather. Figure 1 shows the GLM’s flash extent density product that displays the total number of GLM-detected flashes in each grid box. It enables users to identify the strongest updraft regions and observe the spatial extent. Figure 1. The evolution of a storm in extreme southwestern Mississippi on May 9, 2019. This series of three images (A: 1503 UTC; B: 1514 UTC; C: 1523 UTC) shows one thunderstorm (dashed yellow circle) as it rapidly intensifies from 6 flashes per grid box per minute (A) to 37 flashes per grid box per minute (C) in just 20 minutes. Click the image for an animation of the data from 1500-1530 UTC. (Image and animation made in collaboration with NASA’s Short-term Prediction Research and Transition Center (SPoRT) and the NWS WFO in Huntsville, Alabama). Figure 1. The evolution of a storm in extreme southwestern Mississippi on May 9, 2019. This series of three images (A: 1503 UTC; B: 1514 UTC; C: 1523 UTC) shows one thunderstorm (dashed yellow circle) as it rapidly intensifies from 6 flashes per grid box per minute (A) to 37 flashes per grid box per minute (C) in just 20 minutes. (Image made in collaboration with NASA’s Short-term Prediction Research and Transition Center (SPoRT) and the NWS WFO in Huntsville, Alabama.) Using GLM observations as a proxy for storm development can be extremely useful, particularly in data sparse regions. An example is provided in Figure 2. This shows GLM observations over the northern half of Nevada. Here, radar coverage is very limited or non-existent. However, the GLM detects lightning in these regions. This is extremely valuable to forecasters as this indicates that convective precipitation is likely occurring, which could lead to flooding in the various canyons that hikers like to explore. Alternatively, forecasters at the Aviation Weather Center can use these GLM data to identify convective activity, particularly in oceanic or other radar-deprived locations. Also, forecasters can monitor the trends to identify when aircraft might be able to use a particular region of air space again.
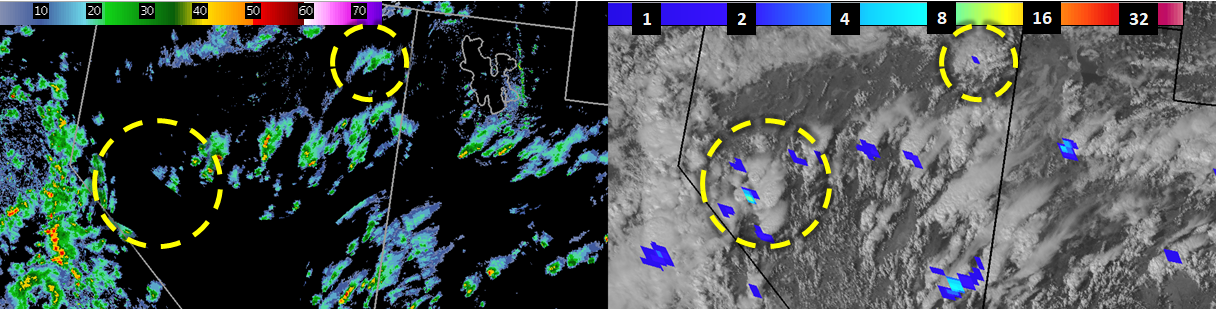
Figure 2. The national radar mosaic (left) and GOES-16 GLM flash extent density (right; flashes per grid box per minute) on the 0.64 micrometer visible imagery centered over Nevada from October 3, 2018, at 2100 UTC. The GLM flash extent density helps highlight convective activity where there is no radar coverage (Western Nevada, large dashed yellow circle) as well as highlight convective activity where radar observations may be degraded (northeast Nevada, small dashed yellow circle). Another fascinating capability of the GLM is its ability to observe the spatiaFtl extent of lightning. Unlike most traditional lightning observations that indicate a single point, such as what is seen on TV, the GLM observations show how far a lightning flash can travel. The current record length for a single flash is 321 kilometers observed by the Oklahoma lightning mapping array. With its near hemispheric field of view, the GLM has regularly observed long flashes and will more than likely identify an even larger flash in the future. Figure 3 shows an example of large extent flashes that occurred over Alabama, Mississippi, and Tennessee on May 9, 2019. The figure shows 1 minute of observations from 1535 and 1544 UTC. In each, the flash extent density observations note several flashes in 1 minute. Combined, the flashes extend ~250 kilometers (160 miles) from Kentucky to the Tennessee-Alabama border (1535 UTC) as well as northwest Alabama to the Tennessee-Kentucky border (1544 UTC). The lower half of Figure 3 shows the average flash area display developed for the NWS. Each grid box displays the average area (square kilometers: km2) of all flashes in that grid box. The dark colors indicate that the average area exceeded 2,000 km2. The area reached over 5,000 km2 in various grid boxes indicating that at least one of the flashes that occurred in the 1-minute period was particularly large. The National Lightning Detection Network observed five and six cloud-to-ground strikes for 1535 and 1544, respectively, with all but one being positive strikes. Animation 2 further illustrates how the lightning flashes generally stayed close to the strongest convection. When the large flashes did occur, each tended to follow the areas of higher reflectivity and generate cloud-to-ground strikes throughout the area. The animation further demonstrates the importance of being able to observe the spatial extent. This ability is invaluable for lightning safety. The weather community teaches the phrase, “When thunder roars, go indoors.” This is designed to let individuals know that the threat of lightning exists outside of just where rain is occurring. In addition, studies of people struck by lightning in the U.S. have shown that most were struck as the thunderstorms approached or departed. The spatial extent observations provide a valuable tool to help individuals visualize the threat that lightning can pose and show them that it can extend well beyond the strongest part of the storm. Click the image to view the animation. Like Figure 3, but without the GLM average flash area, as an animation from 1500-1530 UTC on May 9, 2019. Note several instances of large flashes across Alabama, Mississippi, and Tennessee. (Animation made in collaboration with the NWS WFO in Huntsville, Alabama.) Figure 3. One-minute observations from 1535 UTC (left) and 1544 UTC (right) for the GLM flash extent density (top; flashes per grid box per minute) and the GLM average flash area (bottom; average area in square kilometersof all flashes in each grid box) on May 9, 2019. These lightning data are overlaid on the multi-radar multi-sensor lowest altitude radar reflectivity and include the National Lightning Detection Network cloud-to-ground strike locations. The key feature in each 1-minute plot is that, combined, the contiguous length of lightning is ~250 kilometers (160 miles) for the flashes in the dashed yellow circle. Cloud-to-ground strikes are also observed in this area. The very large values depicted in the bottom average flash area plots show that at least one flash was exceptionally large. (Image made in collaboration with the NWS WFO in Huntsville, Alabama.) The examples here are just the beginning of what we can expect to see from the GLM. With the GLM data now more widely available, new research and applications efforts will follow. These efforts range from using the optical energy observed by the GLM to using the high temporal resolution and spatial extent observations to enhance lightning safety. May Weather Recap 
Click the infographic to download and share! A flurry of thunderstorms with tornadic activity and record-breaking floods was carried across the plains and Mississippi valley throughout May 2019. Here's a quick look at the reports:
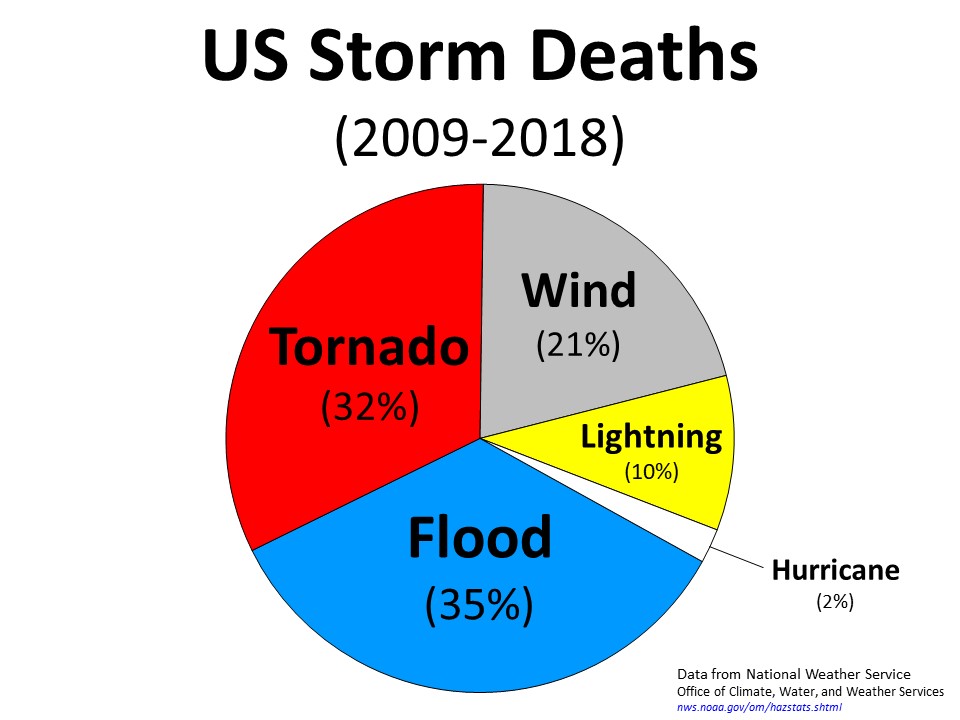
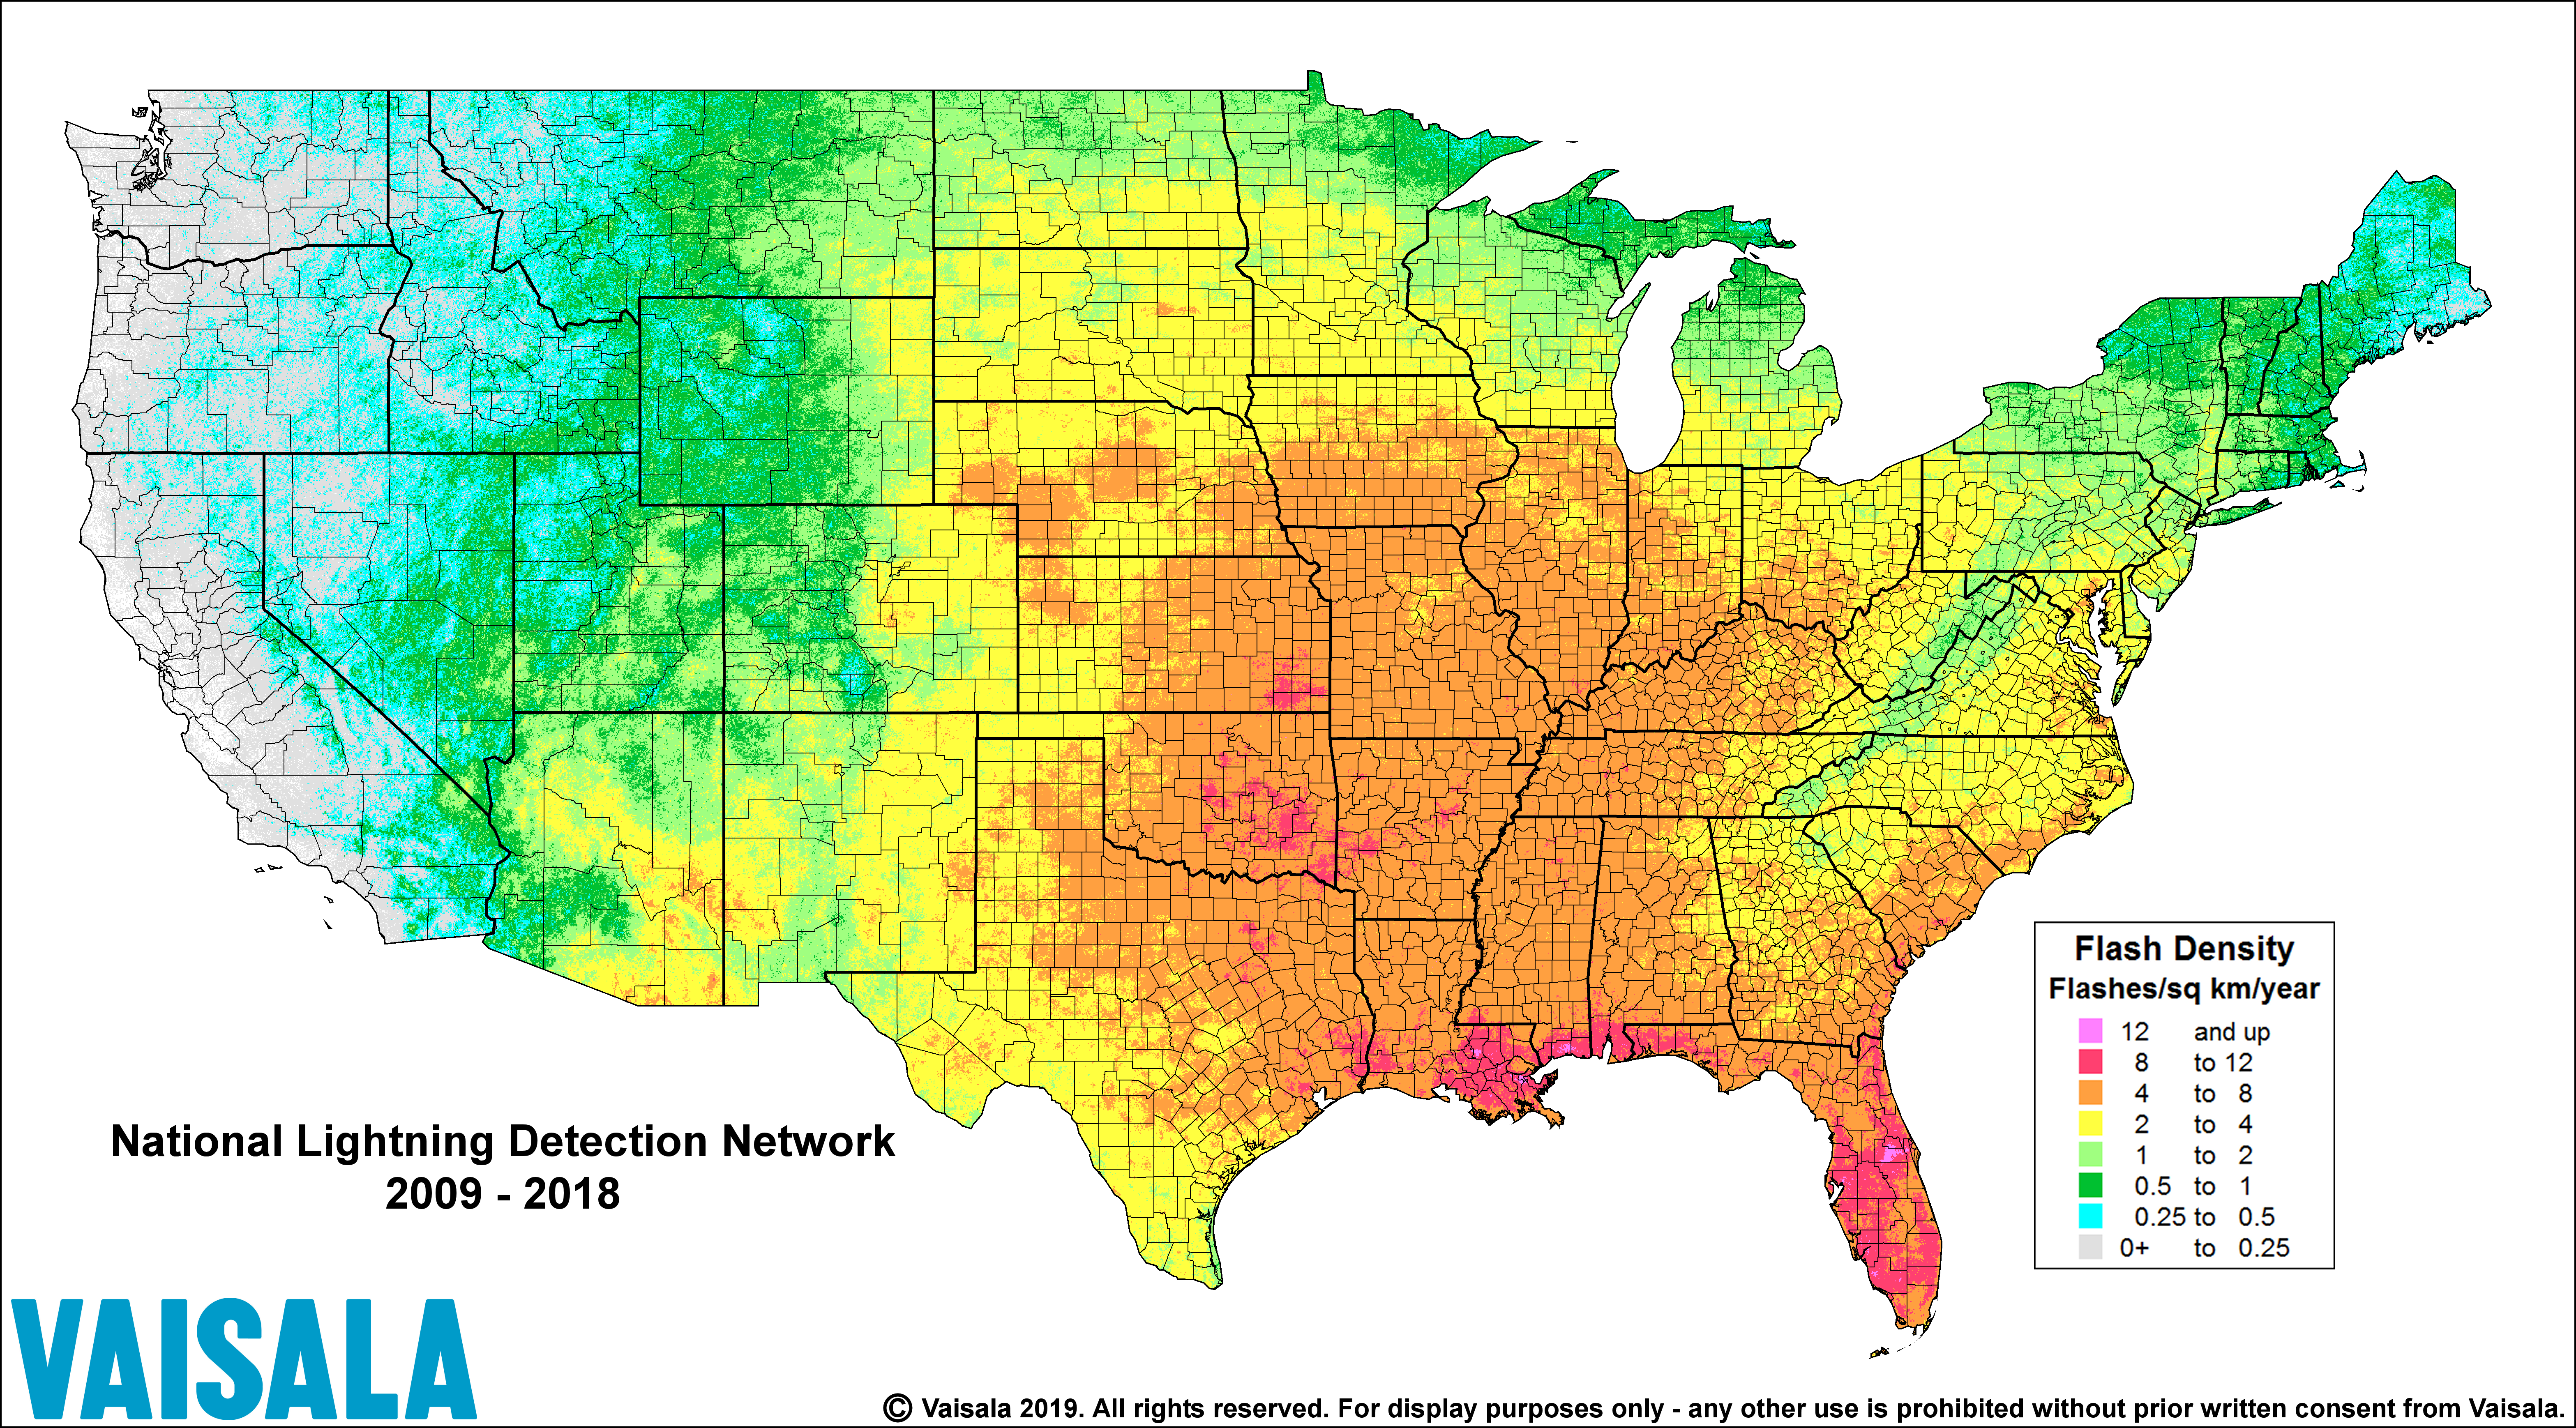
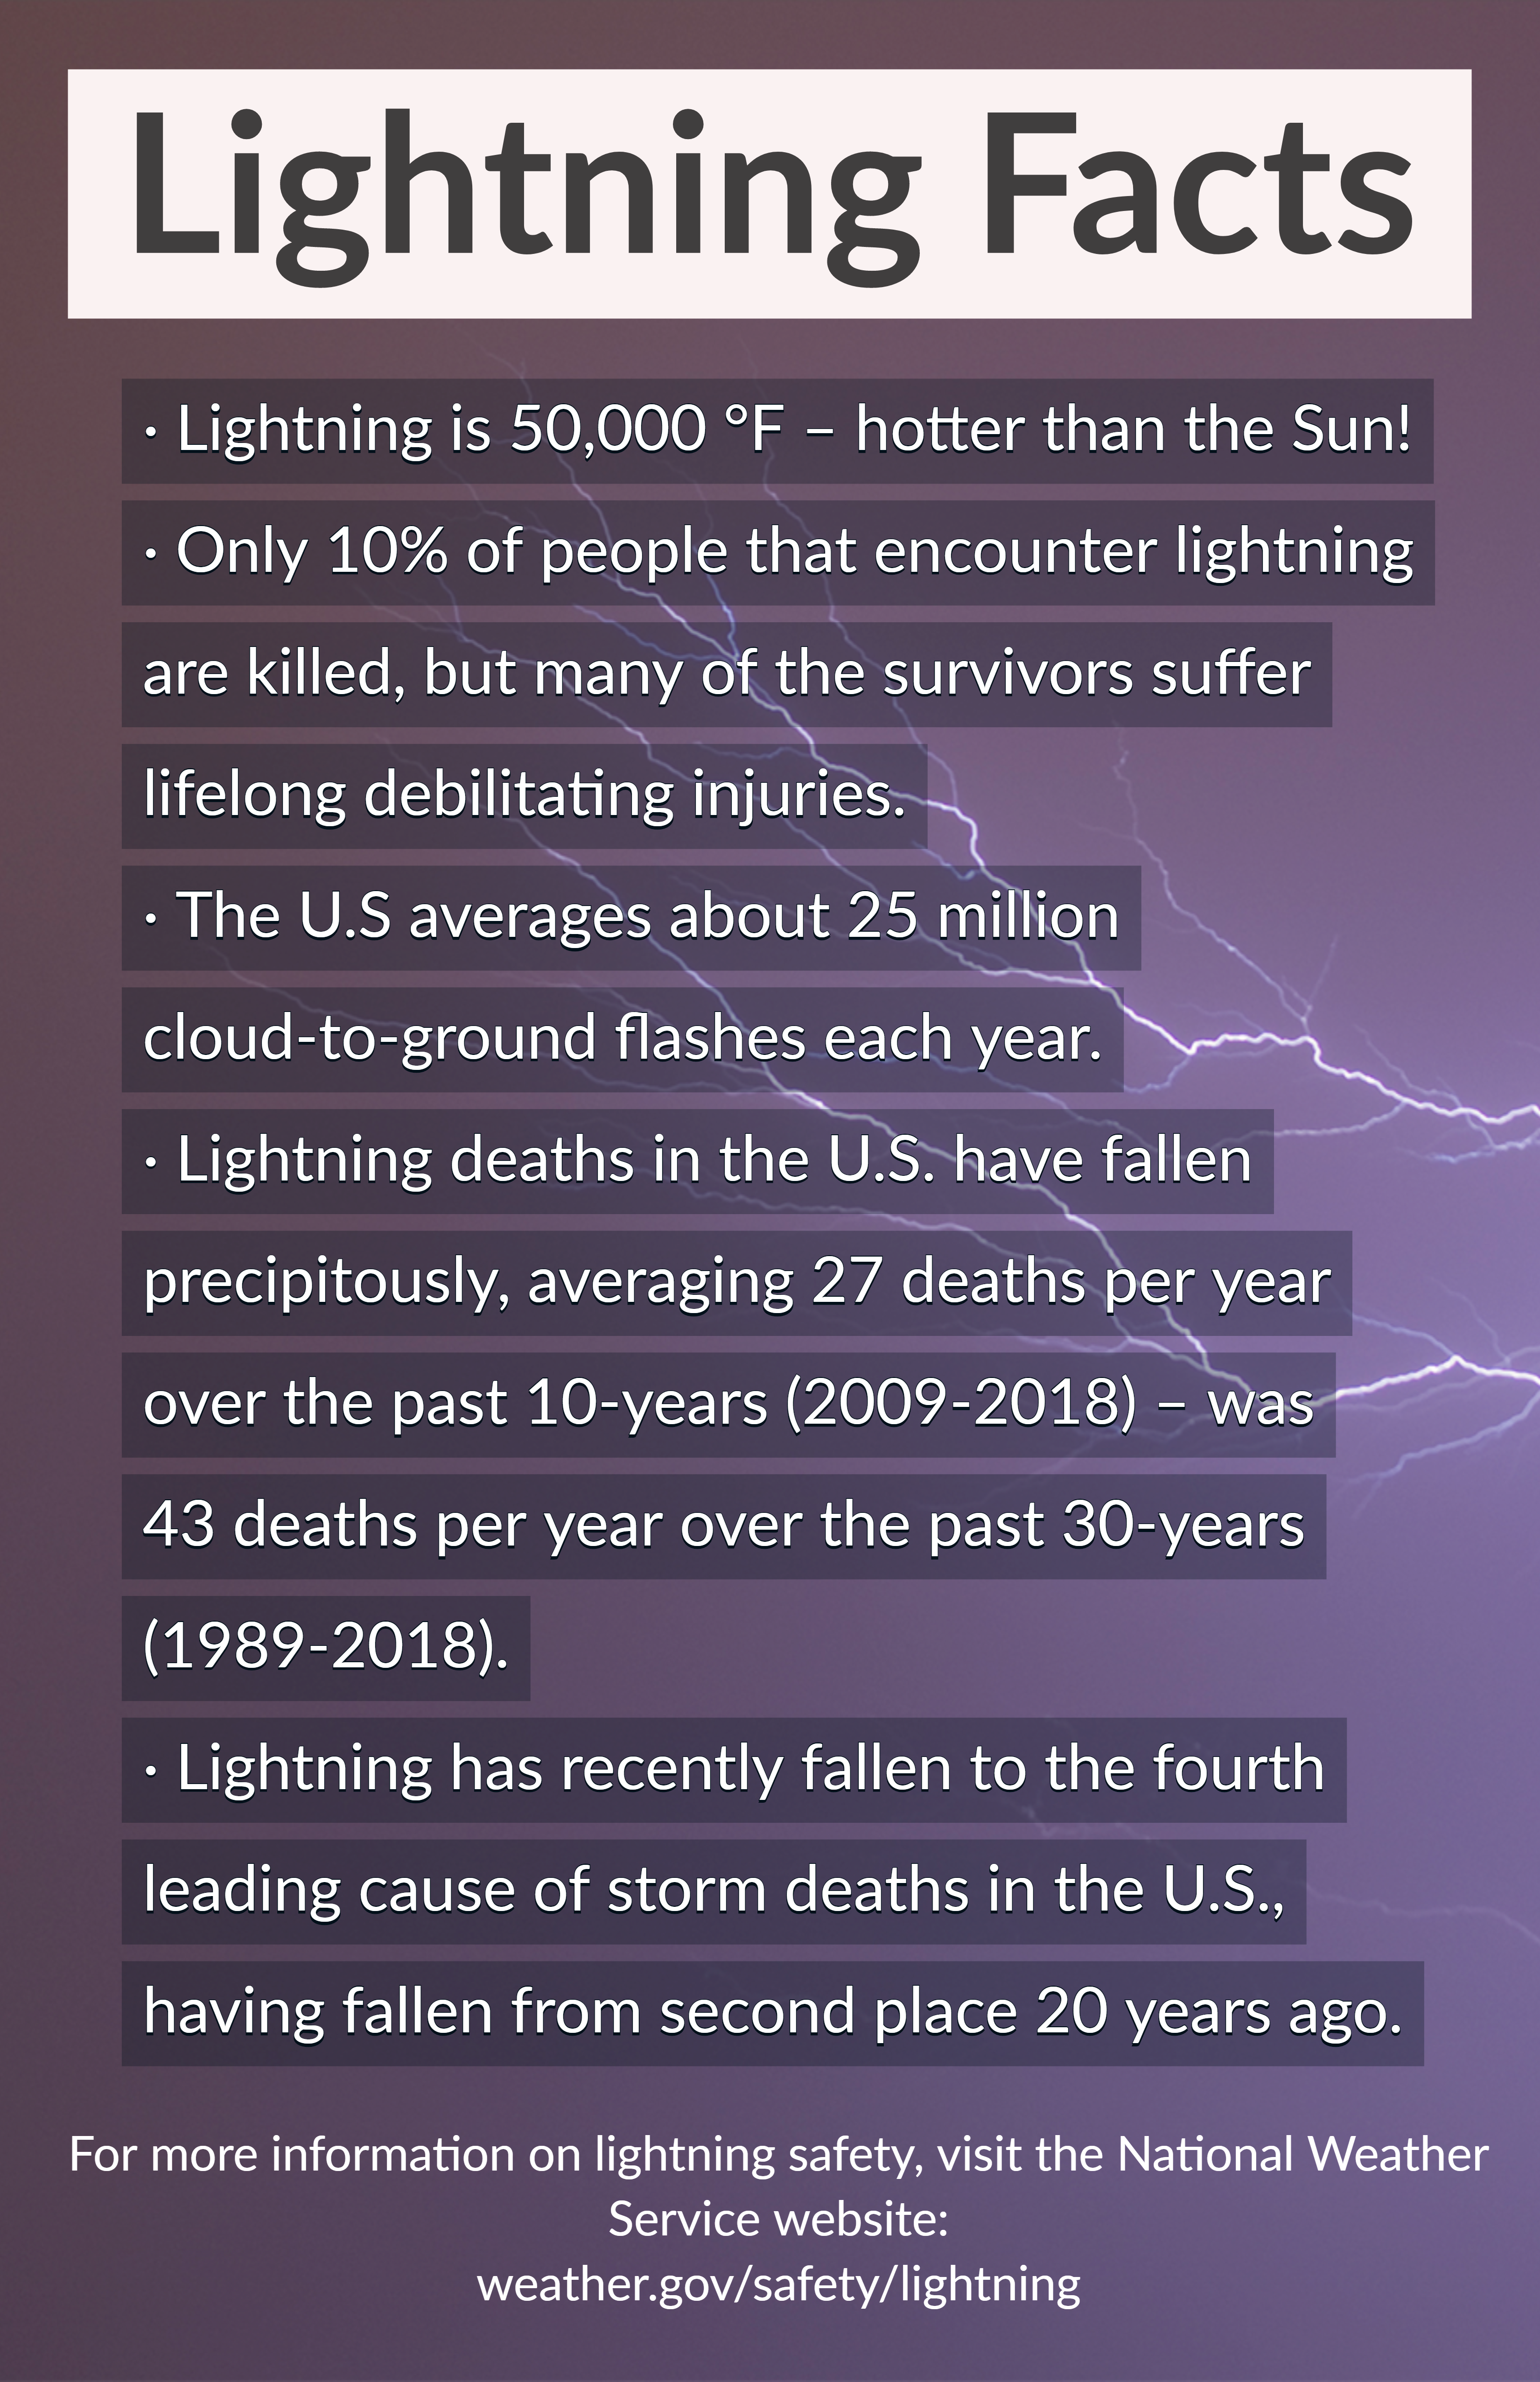
TORUS 2019 Field Project The TORUS project (Targeted Observation by Radars and UAS of Supercells), running from May 13 through June 16, is being conducted by more than 50 scientists and students deploying a broad suite of cutting-edge instrumentation over the U.S. Great Plains during the 2019 and 2020 storm seasons. The goal of TORUS is to collect data and use it to improve the conceptual model of supercell thunderstorms by exposing how small-scale structures within these storms might lead to tornado formation. These structures are hypothesized to be nearly invisible to all but the most precise research-grade instruments. By revealing the hidden composition of severe storms and associating it to known characteristics of the regularly observed larger scale environment, the TORUS project could improve supercell and tornado forecasts. They have certainly had plenty of weather to study! TORUS is led by the University of Nebraska-Lincoln with a team that includes the University of Colorado Boulder, Texas Tech University, the NOAA National Severe Storms Laboratory, and the Cooperative Institute for Mesoscale Meteorological Studies. The instrumentation suite includes four unmanned aircraft systems, three mobile radars, eight mobile mesonets, a mobile LIDAR, three mobile sounding systems, and the NOAA P3 manned aircraft. Lightning Safety—When Thunder Roars, Go Indoors! You’re jogging outside and you hear thunder; what do you do? Lightning is the fourth leading source of storm deaths in the U.S. (Figure 1). The area encompassing the Southeast U.S., Gulf states, Midwest, and the Front Range of the Rocky Mountains has a higher flash density that the rest of the country (Figure 2). Florida has the highest flash density of all the states with central Florida being known as ‘Lightning Alley’. However, no place in the U.S. is safe from lightning.
Figure 1: Pie chart of storm death sources (2009-2018). The U.S. lightning season usually starts in June and ends in September. However, lightning can occur any time of year. Lightning can strike 10 miles or more outside the rain of a thunderstorm. Just because it’s not raining where you are, or even if there are no clouds overhead, does not mean you are safe. In the past, lightning was the second leading source of storm deaths in the U.S. Public education over the past 20 years has cut the rate of lightning deaths by half and lightning has fallen precipitously into fourth place (NWA scoop: New result, first reported here!). Weather safety education works! Only about 10% of people who encounter lightning are killed, but many of the survivors suffer life-long debilitating injuries, especially neurological damage. About 70% of lightning survivors require long-term medical care. In the U.S., 99% of lightning deaths occur outdoors. Of the remaining 1% of indoor lightning deaths, all were people not obeying the indoor lightning safety rules. Going inside and following the indoor rules provides excellent lightning safety.
Figure 2: Map of CONUS average flash density (2009-2018). Lightning safety can be summarized with three slogans and three levels of action. Three Slogans: Slogan-1: No Place Outdoors Is Safe When Thunderstorms Are In The Area! Slogan-2: When Thunder Roars, Go Indoors! Slogan-3: Half An Hour Since Thunder Roars, Now It’s Safe To Go Outdoors! Four Levels: Level-1 (Prevention): Schedule outdoor activities to avoid the lightning hazard. Use the local forecasts from your local NWS forecast office (www.weather.gov). Know the local thunderstorm patterns. Level-2 (Awareness): Know when and where to go for lightning safety. Watch the skies for signs of approaching or locally developing thunderstorms. If you hear thunder, the storm is close enough to be a danger—go to a safe place quickly! One safe place is a large fully enclosed building with wiring and plumbing: a typical house, school, office, store, etc. Another safe place from lightning is a vehicle with a solid metal roof and solid metal sides: a typical car, truck or bus. When indoors, stay away from conducting paths to the outside: corded telephones (except for emergencies), electrical appliances and wiring, and plumbing. Level-3 (Risk Reduction): If you must be outside with thunderstorms in the area, you are in danger. Reduce your risk. Avoid elevated places and wide-open areas like sports fields and beaches. Avoid tall isolated objects—do NOT go under trees to avoid the rain. Avoid swimming, boating and fishing. Avoid small open structures when possible, such as pavilions and rain shelters, as they usually provide no lightning protection and can be more dangerous than being in an open area. Level-4 (First Aid): Lightning deaths are from cardiac or respiratory arrest. Use CPR or rescue breathing, as needed. Have someone call 911. If an automated external defibrillator (AED) is available, use it on victims who are unconscious or unresponsive. If the AED doesn’t fire, resume the CPR. So, if you are jogging or doing any other activity outside, remember these four slogans and four levels of lightning safety. More information on lightning safety is at www.weather.gov/safety/lightning.
Click the infographic to download and share! More Lightning Safety Statistics and Information The FCC Needs Critical Comments on GOES Spectrum by June 21 The Federal Communications Commission (FCC) issued a Notice of Proposed Rulemaking regarding sharing of the 1675-1680 MHz radio frequency (RF) spectrum that GOES satellites use to transmit and receive data. The FCC wants input on the NPRM, and comments are due by June 21, 2019.
Here are resources on this topic:
Two Meteorologists earned the TV Seal of Approval in June
Her first full-time meteorology position was at WTEN in Albany, New York, where she not only worked on forecasting, but also spent time in the Mobile Weather Tracker. From there she covered breaking weather across three states: New York, Massachusetts and Vermont. Christina's latest move has brought her even closer to home. At WJAR in Providence, Rhode Island, she is back covering coastal New England weather and "couldn't be happier." One of her favorite parts of the job is getting to make an impact in viewers daily lives. Whether it's going to school visits, tracking snowstorms, or continuing to hone her talent as a meteorologist, she "looks forward to learning more about the weather every day." Congratulations Christina!
"I love what I do because it's about helping people," says Hannah. She does her best to go beyond her forecast and include additional information to help educate her viewers. She states that "if they better understand the weather and the struggles of forecasting, they will make better decisions when weather impacts their lives." Hannah is passionate about communicating via social media. She also makes time for weather talks at schools and adult groups. Great work Hannah! Congratulations to our other recent seal holders, Chris Nestman and David Wolter, who will be featured in our July newsletter.
Help promote a Weather-Ready Nation!
New Images of Note in the Journal of Operational Meteorology
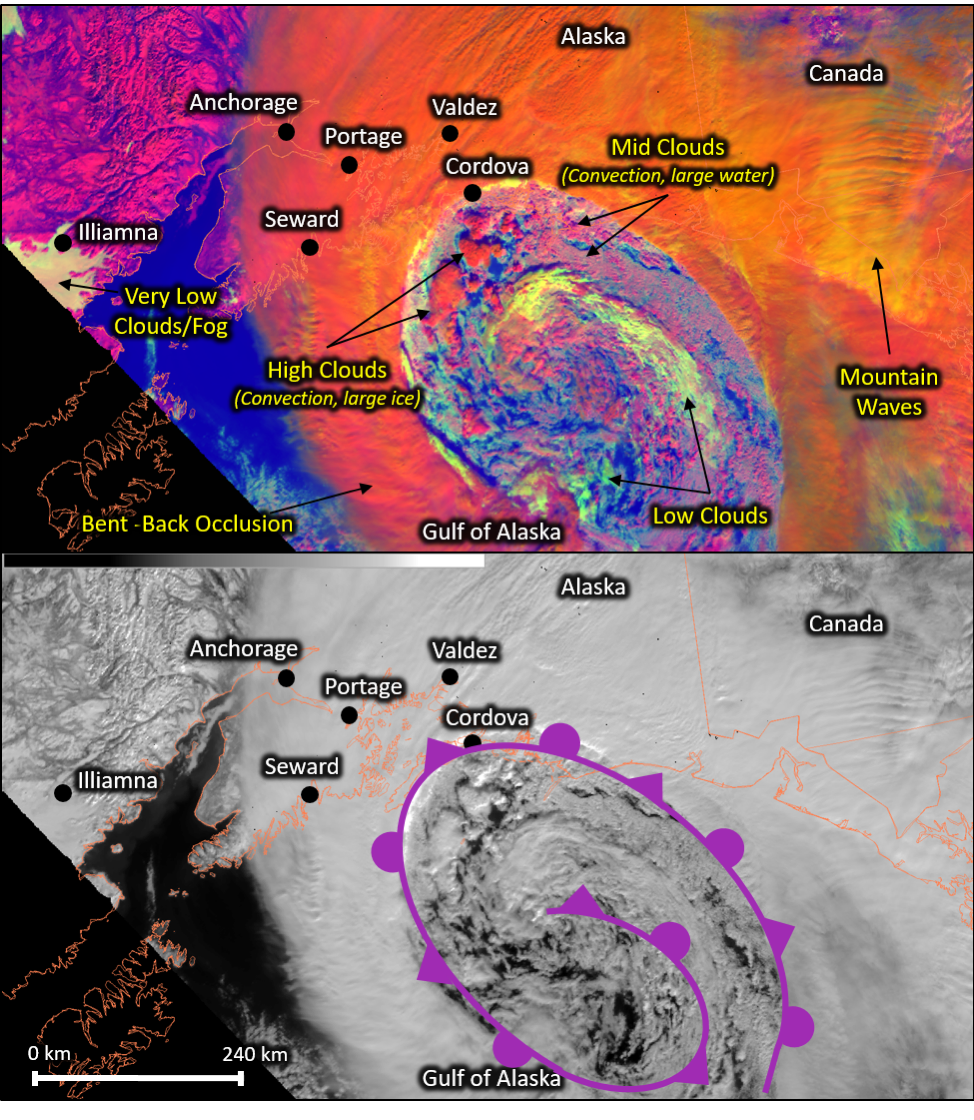
Figure 1 from JOM 2019-3: Daytime Microphysics RGB (upper panel) and 0.64 µm visible imagery (lower panel) at 2029 UTC 11 March 2018 from S-NPP Visible Infrared Imaging Radiometer Suite (VIIRS) imager. Visible imagery is provided for comparison to what forecasters typically use for daytime imagery and includes an annotation for the occluded front in purple. Although the frontal boundary is identifiable in both, other more subtle features noted in the RGB have less contrast in the visible image. JOM 2019-3 (Article): Gulf of Alaska Cyclone in Daytime Microphysics RGB Imagery by Lawson, M. T. and K. K. Fuell. The JOM publishes submissions in four categories: Article, Short Contribution, Images of Note and Commentary. The JOM is a peer-reviewed, all-electronic journal with an international scope, providing authors with the benefits of economical publication costs and rapid publication following acceptance. If you are interested in submitting a paper to the JOM, please go to the website for author information. Thank you to the JOM authors, reviewers and editors for continuing to make JOM a success!
National Weather Association | 3100 Monitor Ave, Suite 123 | Norman OK 73072 | 405.701.5167 Publisher: Janice Bunting, NWA Executive Director ISSN 0271-1044 |


 Christina Erne feels like she has "the best job in the world!" Originally from Concord, Massachusetts, she earned her broadcast journalism degree from Boston University. Upon graduating, she landed her first job as a reporter at WLBZ in Bangor, Maine. Christina then went on to earn her meteorology certificate from Mississippi State University.
 Next up we have Hannah Strong. Hannah received her Bachelor of Science degree in geosciences from Mississippi State University with a concentration in professional meteorology. She started her career at WANE in Fort Wayne, Indiana, before making the move to WDRB in Louisville, Kentucky, in October of 2017.
Announcements

Are you WeatherReady? NWS weather preparedness information.
The NWA is proud to be a Weather-Ready Nation Ambassador™.
*********
For assistance, please contact:
[email protected]
405-701-5167